Tracing quickstart
This section illustrates how to enable tracing support of Policy Server.
Before continuing, make sure you completed the previous OpenTelemetry section of this book. It is required for this section to work correctly.
Tracing allows to collect fine grained details about policy evaluations. It can be a useful tool for debugging issues inside of your Kubewarden deployment and policies.
We will use Jaeger -- used to receive, store and visualize trace events.
Install Jaeger
We are going to use the Jaeger Operator to manage all the different Jaeger components. The operator can be installed in many ways. We are going to install via Helm charts.
At the time of writing, only specific versions of Jaeger are compatible with Cert Manager, see the compat chart.
To install the Helm chart:
At time of writing the latest chart version is 2.49.0
helm repo add jaegertracing https://jaegertracing.github.io/helm-charts

helm upgrade -i --wait \
  --namespace jaeger \
  --create-namespace \
  --version 2.49.0 \
  jaeger-operator jaegertracing/jaeger-operator \
  --set rbac.clusterRole=true
This is not meant to be a production deployment. We strongly recommend to read Jaeger's official documentation.
Let's create a Jaeger resource:
kubectl apply -f - <<EOF
apiVersion: jaegertracing.io/v1
kind: Jaeger
metadata:
  name: my-open-telemetry
  namespace: jaeger
spec:
  ingress:
    enabled: true
    annotations:
      kubernetes.io/ingress.class: nginx
EOF
Once all the resources have been created by the Jaeger operator, we will have a
Service under my-open-telemetry-collector.jaeger.svc.cluster.local.
The Jaeger Query UI will be reachable at the following address:
echo http://`minikube ip`
Install Kubewarden
We can proceed to the deployment of Kubewarden in the usual way.
cert-manager is a requirement of Kubewarden, and OpenTelemetry is required for this feature, but we've already installed them in a previous section of this book.
As a first step, we have to add the Helm repository that contains Kubewarden:
helm repo add kubewarden https://charts.kubewarden.io
Then we have to install the Custom Resource Definitions (CRDs) defined by Kubewarden:
helm install --wait \
  --namespace kubewarden \
  --create-namespace \
  kubewarden-crds kubewarden/kubewarden-crds
Now we can deploy the rest of the Kubewarden stack. The official
kubewarden-defaults helm chart will create a PolicyServer named default. We
want this PolicyServer instance to have tracing enabled.
In order to do that, we have to specify some extra values for the
kubewarden-controller chart. Let's create a values.yaml file with the
following contents:
telemetry:
  tracing:
    enabled: True
    jaeger:
      endpoint: "my-open-telemetry-collector.jaeger.svc.cluster.local:4317"
      tls:
        insecure: true
To keep things simple, we are not going to encrypt the communication between the OpenTelemetry collector and the Jaeger endpoint.
This is not meant to be a production deployment. We strongly recommend to read Jaeger's official documentation.
Then we can proceed with the installation of the helm charts:
helm install --wait --namespace kubewarden --create-namespace \
  --values values.yaml \
  kubewarden-controller kubewarden/kubewarden-controller

helm install --wait --namespace kubewarden --create-namespace \
  kubewarden-defaults kubewarden/kubewarden-defaults
This leads to the creation of the default instance of PolicyServer:
kubectl get policyservers.policies.kubewarden.io
NAME      AGE
default   3m7s
Looking closer at the Pod running the PolicyServer instance, we will find it has
two containers inside of it: the actual policy-server and the OpenTelemetry
Collector sidecar otc-container.
Enforcing a policy
We will start by deploying the safe-labels policy.
We want the policy to be enforced only inside of Namespaces that have a
label environment with value production.
Let's create a Namespace that has such a label:
kubectl apply -f - <<EOF
apiVersion: v1
kind: Namespace
metadata:
  name: team-alpha-prod
  labels:
    environment: production
EOF
Next, let's define a ClusterAdmissionPolicy:
kubectl apply -f - <<EOF
apiVersion: policies.kubewarden.io/v1alpha2
kind: ClusterAdmissionPolicy
metadata:
  name: safe-labels
spec:
  module: registry://ghcr.io/kubewarden/policies/safe-labels:v0.1.6
  settings:
    mandatory_labels:
    - owner
  rules:
    - apiGroups:
        - apps
      apiVersions:
        - v1
      resources:
        - deployments
      operations:
        - CREATE
        - UPDATE
  namespaceSelector:
    matchExpressions:
    - key: environment
      operator: In
      values: ["production"]
  mutating: false
EOF
We can wait for the policy to be active in this way:
kubectl wait --for=condition=PolicyActive clusteradmissionpolicy/safe-labels
Once the policy is active, we can try it out in this way:
kubectl apply -f - <<EOF
apiVersion: apps/v1
kind: Deployment
metadata:
  name: nginx-deployment
  namespace: team-alpha-prod
  labels:
    owner: octocat
spec:
  selector:
    matchLabels:
      app: nginx
  replicas: 0
  template:
    metadata:
      labels:
        app: nginx
    spec:
      containers:
      - name: nginx
        image: nginx:latest
        ports:
        - containerPort: 80
EOF
This Deployment object will be created because it doesn't violate the policy.
On the other hand, this Deployment will be blocked by the policy:
kubectl apply -f - <<EOF
apiVersion: apps/v1
kind: Deployment
metadata:
  name: nginx-deployment-without-labels
  namespace: team-alpha-prod
spec:
  selector:
    matchLabels:
      app: nginx
  replicas: 0
  template:
    metadata:
      labels:
        app: nginx
    spec:
      containers:
      - name: nginx
        image: nginx:latest
        ports:
        - containerPort: 80
EOF
The policy is not enforced inside of another Namespace.
The following command creates a new Namespace called team-alpha-staging:
kubectl apply -f - <<EOF
apiVersion: v1
kind: Namespace
metadata:
  name: team-alpha-staging
  labels:
    environment: staging
EOF
As expected, the creation of a Deployment resource that doesn't have any label
is allowed inside of the team-alpha-staging Namespace:
kubectl apply -f - <<EOF
apiVersion: apps/v1
kind: Deployment
metadata:
  name: nginx-deployment-without-labels
  namespace: team-alpha-staging
spec:
  selector:
    matchLabels:
      app: nginx
  replicas: 0
  template:
    metadata:
      labels:
        app: nginx
    spec:
      containers:
      - name: nginx
        image: nginx:latest
        ports:
        - containerPort: 80
EOF
As expected, this resource is successfully created.
Exploring the Jaeger UI
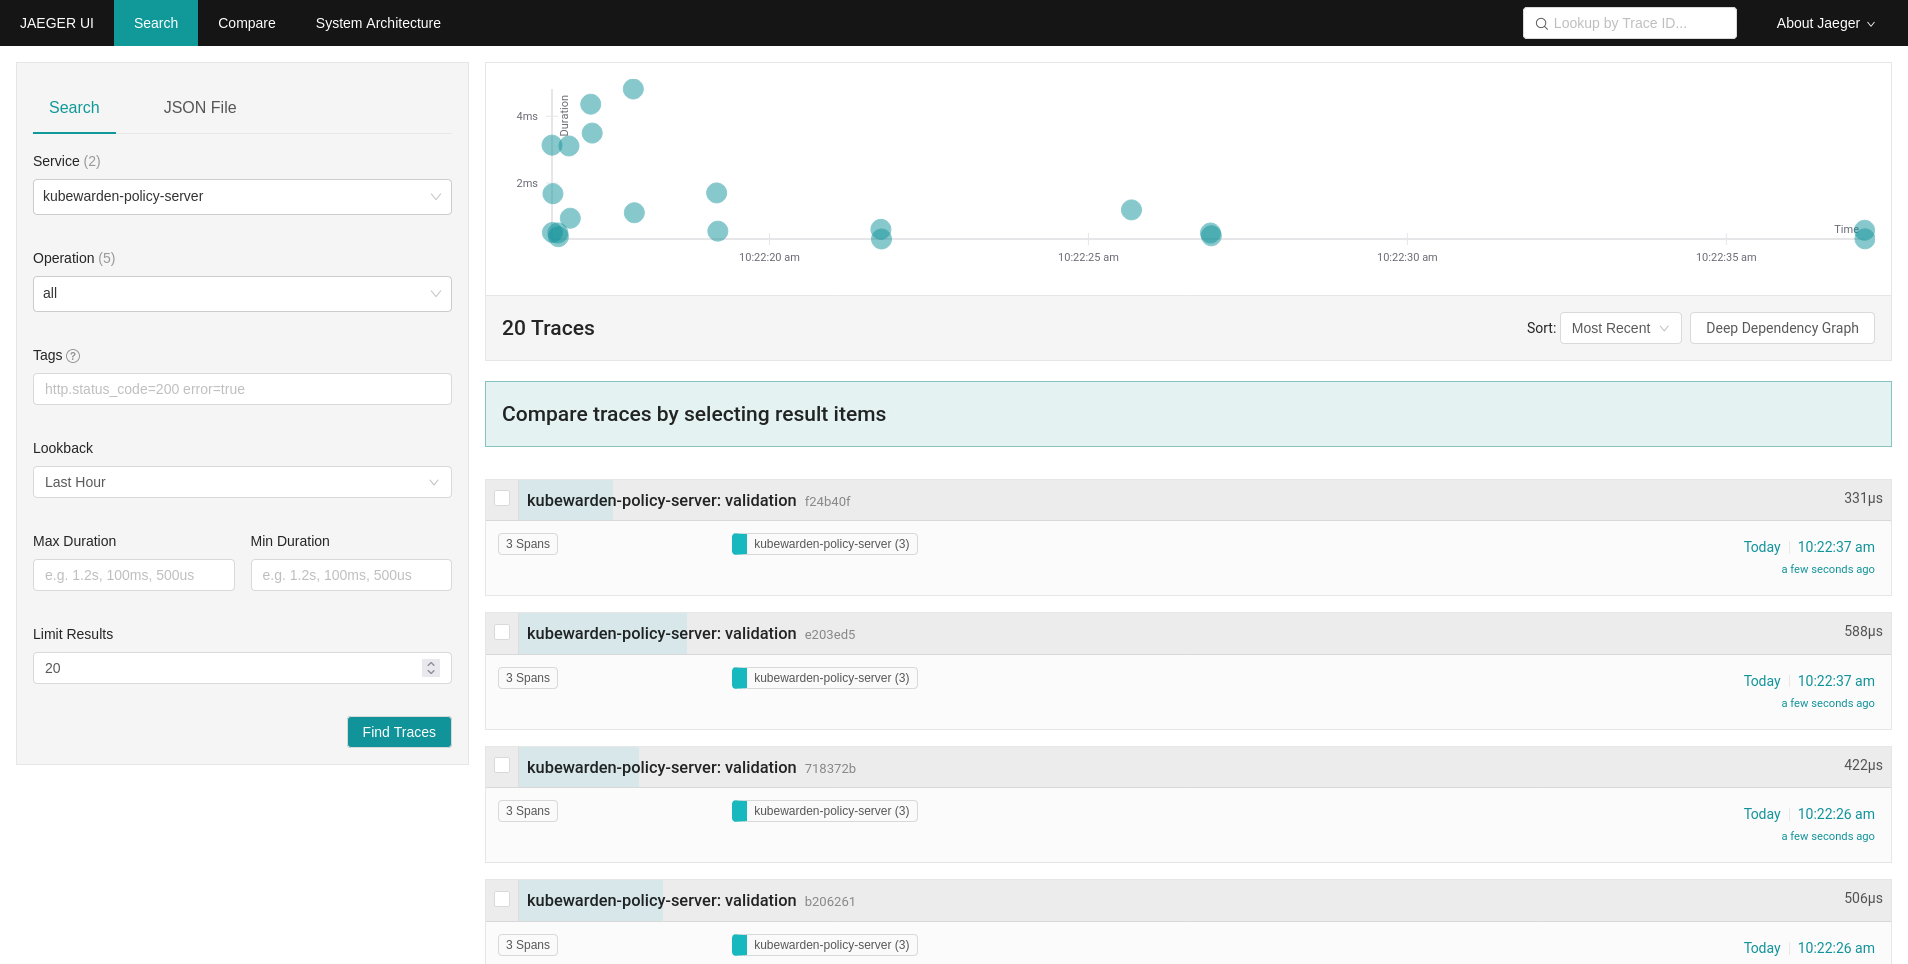
We can see the trace events have been sent by the PolicyServer instance to Jaeger,
as there is a new service kubewarden-policy-server listed in the UI:

The Jaeger collector is properly receiving the traces generated by our PolicyServer.